
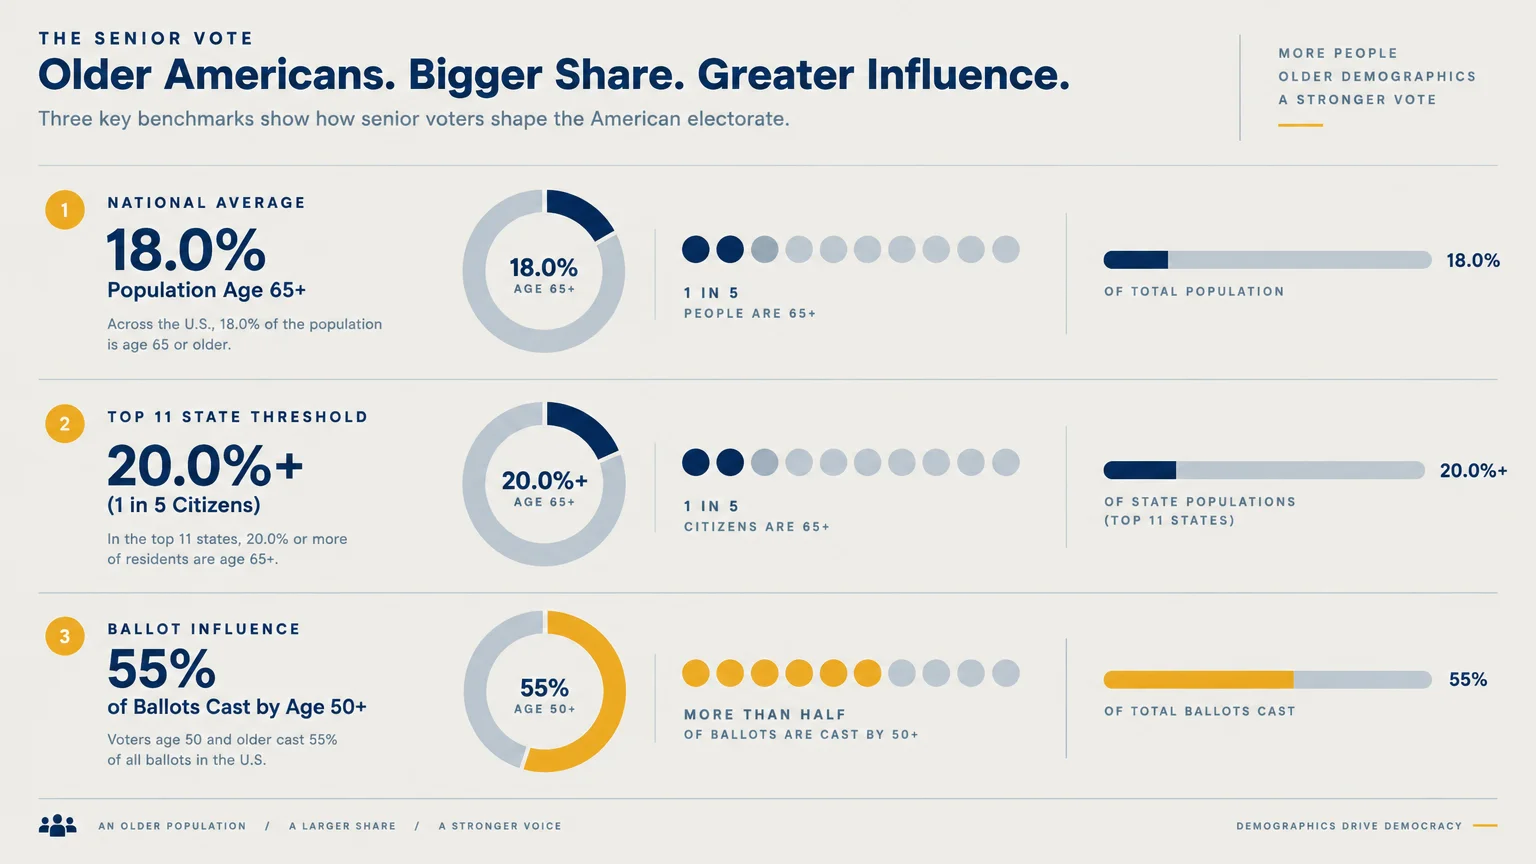
Your vote carries unmatched weight in American elections today. Retirees consistently out-vote every other demographic group, turning statistical presence into decisive political power nationwide.
In the most recent presidential election, nearly three out of four older citizens cast ballots. That extraordinary participation rate gives older voters immense sway over healthcare, tax policy, and Social Security.
While retirees drive civic decisions across the country, eleven states boast the highest concentrations of older residents. Discover where retiree voting power shapes local and national policy most dramatically.
The Demographic Math Behind Retiree Voting Power
Older Americans demonstrate an unmatched commitment to the ballot box every election cycle. They view voting as a non-negotiable civic duty rather than an occasional chore.
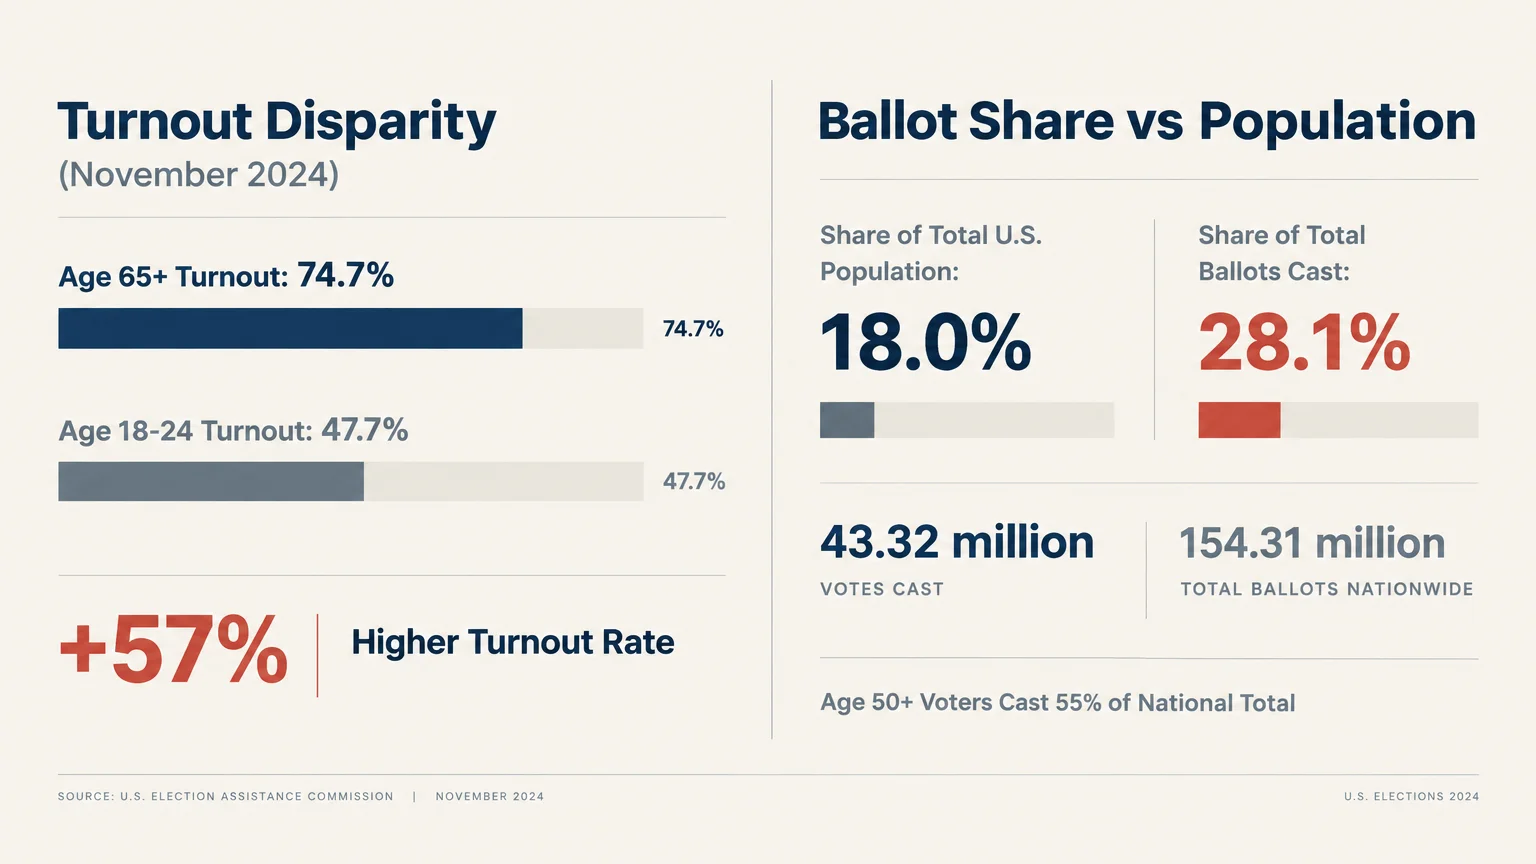
During the November 2024 presidential election, 74.7% of U.S. citizens aged 65 and older voted. That turnout represented 43.32 million voters out of 154.31 million total ballots nationwide.
Seniors were the only demographic group to increase their participation rate compared to the 2020 election. By comparison, only 47.7% of citizens aged 18 to 24 cast ballots.
That means older adults were 57% more likely to vote than the youngest eligible cohort. When candidates review precinct maps, they focus intently on neighborhoods with dense senior populations.
Voters aged 65 and older accounted for 28.1% of all ballots cast in 2024. Yet this group makes up just 18.0% of the total U.S. population.
Demographic research from AARP reveals an even broader trend. When you expand the window to voters aged 50 and older, they generate 55% of all ballots cast nationally.
“A great retirement is designed with intention, where you protect your resources and stay engaged with the world around you.” — Suze Orman, Personal Finance Expert
Why Older Voters Dominate Midterm and Local Elections
While presidential contests draw massive media coverage, midterm elections highlight senior voters even more. Midterm turnout among younger demographics historically collapses, leaving seasoned voters in command.
Across the two most recent federal cycles, average participation among citizens 65 and older held steady at 70.8%. Younger brackets saw double-digit participation declines during midterm cycles.
As the November 3, 2026 midterm elections approach, that historical dynamic will surface again. Retirees will cast an even larger percentage of total ballots in state and congressional races.
Older voters pay close attention to policy debates because the outcomes directly affect daily life. Programs like Medicare, managed through Medicare.gov, require stable federal oversight.
Retirees also monitor the financial health of the trust funds administered by the Social Security Administration. They recognize that local school levies, municipal zoning, and property tax exemptions directly influence fixed retirement budgets.
The 11 States With the Highest Share of Retiree Voters
Across the United States, eleven states feature populations where at least one in every five residents is 65 or older. In these jurisdictions, senior voters form a demographic powerhouse that candidates cannot ignore.
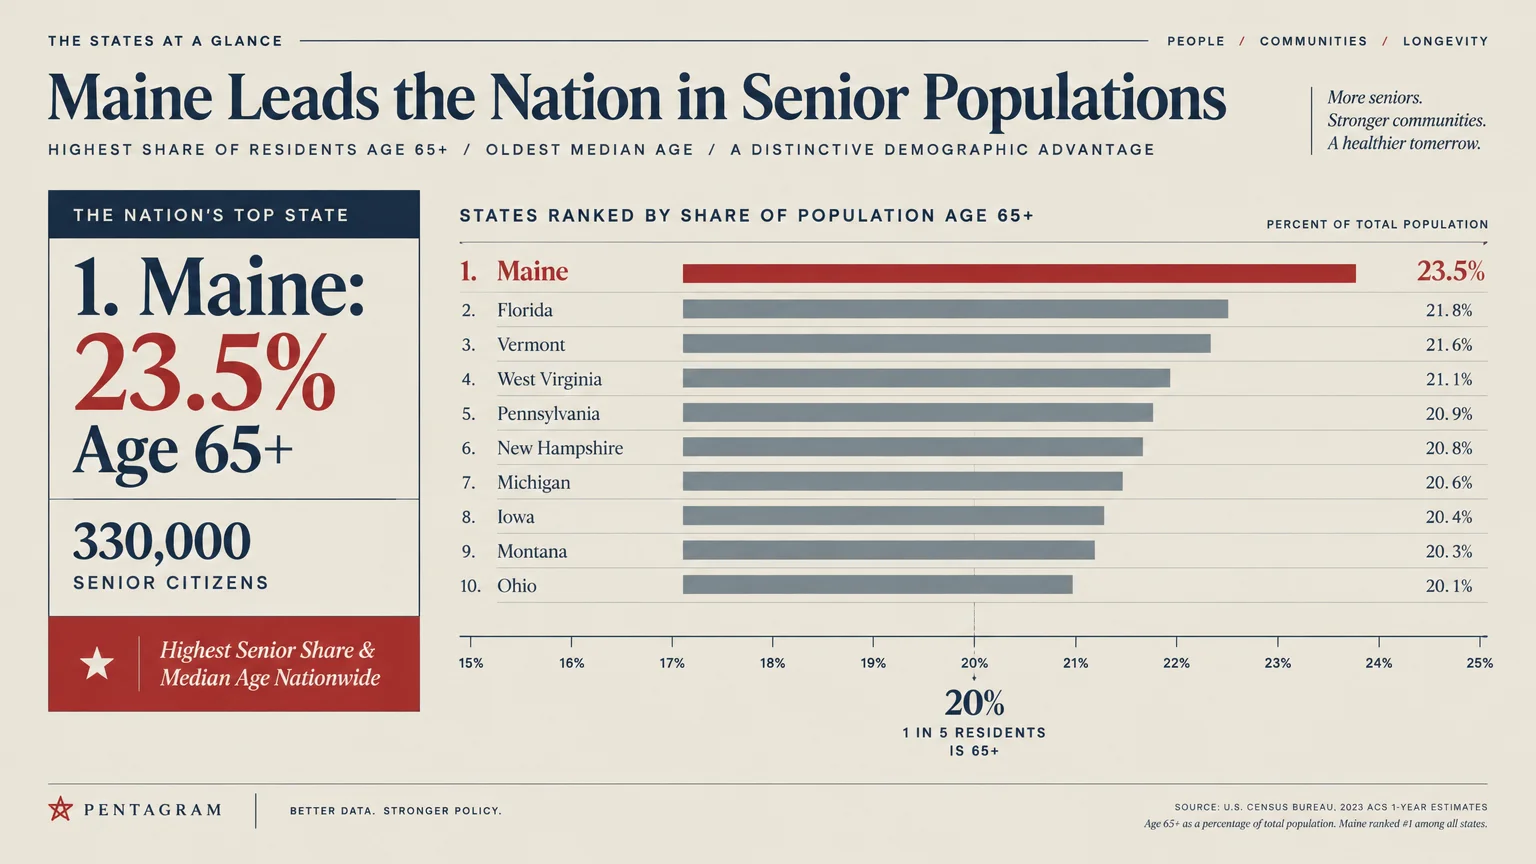
1. Maine: 23.5% Age 65+
Maine holds the distinction of being the oldest state in the country by both median age and senior proportion. Approximately 23.5% of Maine residents are 65 or older, representing roughly 330,000 citizens.
Decades of youth outmigration combined with retirees settling along the coast have solidified this older demographic profile. You will see older Mainers packing town hall meetings and rural polling places every November.
State legislators prioritize issues like rural healthcare access, home heating subsidies, and prescription drug cost caps. If you retire in Maine, your vote directly affects state-level tax relief for senior homeowners.
2. Vermont: 22.9% Age 65+
Vermont ranks second nationally, with seniors making up 22.9% of the state’s total population. That percentage translates to approximately 148,000 older citizens who maintain a deeply ingrained tradition of civic participation.
Annual Town Meeting Days in Vermont give older residents direct oversight of municipal budgets and infrastructure priorities. The state’s aging population keeps healthcare affordability and long-term care staffing at the top of the legislative docket.
Older Vermonters also push hard for property tax stability, balancing conservation efforts with community preservation. State politicians across party lines tailor their platforms to appeal directly to this reliable voting bloc.
3. West Virginia: 21.9% Age 65+
West Virginia ranks third, with 21.9% of its population aged 65 and older. That equates to roughly 387,000 seniors living across the Mountain State.
Interestingly, West Virginia registered the lowest senior voter turnout in the country during the 2024 election at 62.8%. Yet because the senior population is so concentrated, older residents still form a commanding portion of the electorate.
Retiree voters in West Virginia focus heavily on chronic disease management, miners’ pensions, and fixed-income protections. Their concerns drive statewide debates regarding state tax exemptions on retirement benefits and local hospital availability.
4. Florida: 21.8% Age 65+
Florida represents the ultimate retirement destination, housing an astounding 5.09 million residents aged 65 and older. That demographic group represents 21.8% of the entire state population.
Florida seniors turn out in massive numbers, participating actively through early voting and no-excuse mail-in ballots. Communities like The Villages and coastal enclaves serve as required stops for national candidates seeking office.
Key political priorities for Florida retirees include property insurance reforms, condominium inspection mandates, and the complete preservation of zero state income tax. Retiree voting power here shapes national policy and presidential politics alike.
5. Delaware: 21.7% Age 65+
Delaware features a senior population of 21.7%, totaling approximately 228,000 older adults. Favorable tax policies and coastal beach towns have transformed Delaware into a premier destination for mid-Atlantic retirees.
Delaware exempts Social Security benefits from state income taxes and offers generous pension exclusions for older residents. These financial advantages attract thousands of relocating retirees who bring strong voter participation habits with them.
Sussex County, in particular, has witnessed tremendous growth in active retirement communities. As a result, county council races and statewide campaigns heavily reflect senior demands for healthcare infrastructure and transportation.
6. Hawaii: 21.5% Age 65+
Hawaii boasts one of the highest life expectancies in the nation, contributing to a senior population of 21.5%. Approximately 311,000 older citizens live across the island chain.
Hawaii’s culture deeply reveres kupuna, or elders, giving older residents immense cultural and civic respect. Older Hawaiians turn out reliably to protect generational healthcare programs and long-term care supports.
Retirees in Hawaii frequently challenge local leaders on the extreme cost of living and specialized medical availability. Because Hawaii conducts all elections through mail-in balloting, older residents participate with ease and high consistency.
7. New Hampshire: 21.5% Age 65+
New Hampshire ties Hawaii with 21.5% of its population aged 65 and older, representing about 303,000 seniors. The Granite State combines an aging population with high political engagement fueled by its first-in-the-nation presidential primary.
Senior voters in New Hampshire scrutinize political candidates up close in diners, community centers, and school gymnasiums. They demand fiscal discipline, vigorously defending the absence of a general state sales or wage income tax.
Local municipal budgets depend heavily on real estate taxes, making older homeowners the primary opponents of sudden property assessment spikes. Candidates who fail to connect with senior voter groups rarely win statewide office here.
8. Montana: 21.2% Age 65+
Montana’s population includes 21.2% seniors, counting roughly 241,000 older residents across its vast landscapes. Retirees love Montana for its outdoor lifestyle, but rural demographics create unique electoral dynamics.
Older Montanans vote early and utilize absentee mail ballots in exceptional numbers to navigate severe winter weather. Their ballots often dictate outcomes in competitive congressional and state judicial races.
Key concerns for Montana retirees include protecting access to rural health clinics and preserving public lands for multi-generational recreation. They also champion property tax relief programs to counter rising home values in popular mountain towns.
9. Pennsylvania: 20.4% Age 65+
Pennsylvania holds 2.67 million seniors, accounting for 20.4% of the Commonwealth’s total population. It ranks fifth in raw senior population nationwide, trailing only California, Florida, Texas, and New York.
Unlike Sun Belt states driven by new arrivals, Pennsylvania’s senior strength comes largely from long-term residents aging in place. Many older Pennsylvanians carry union backgrounds and hold strong partisan habits formed over decades.
Because Pennsylvania remains one of the country’s most critical swing states, older voters carry unbelievable national influence. Campaigns spend millions courting retirees across Philadelphia suburbs, industrial valleys, and rural counties.
10. New Mexico: 20.1% Age 65+
New Mexico’s senior demographic has reached 20.1%, accounting for roughly 429,000 older residents. The state attracts retirees seeking cultural diversity, mild climates, and affordable desert living.
Older Hispanic and Native American populations contribute significantly to New Mexico’s distinct civic fabric. Retirees turn out reliably to vote on bond measures funding senior centers, libraries, and public transportation networks.
Healthcare access remains the paramount issue for older New Mexicans, particularly in remote southern and northern communities. Candidates actively court retiree associations to gain credibility on Medicaid expansion and physician recruitment initiatives.
11. Wyoming: 20.0% Age 65+
Wyoming rounds out the top eleven, with exactly 20.0% of its population aged 65 and older. While its raw count sits at around 117,000 seniors, their civic presence is enormous.
Wyoming’s low population density means older voters personally know their county commissioners and state representatives. Senior participation rates consistently outpace younger generations by wide margins in both primary and general elections.
Older Wyoming residents strongly advocate for mineral-funded tax relief, hospital district funding, and personal freedom. They leverage their voting power to preserve Wyoming’s status as a low-tax haven with no individual income tax.
Retiree Voter Concentration at a Glance
Understanding how these eleven states compare helps clarify where retiree voting power produces the most significant outcomes. The table below outlines key demographic data and primary policy drivers across the leading states.
| State | Share 65+ | Estimated 65+ Population | Primary Policy Priorities |
|---|---|---|---|
| Maine | 23.5% | 330,000 | Rural healthcare, heating aid, property tax stability |
| Vermont | 22.9% | 148,000 | Long-term care, town meeting budgets, tax caps |
| West Virginia | 21.9% | 387,000 | Prescription drug costs, pensions, hospital access |
| Florida | 21.8% | 5,090,000 | Property insurance, HOA rules, maintaining zero income tax |
| Delaware | 21.7% | 228,000 | Retirement tax exemptions, coastal infrastructure |
| Hawaii | 21.5% | 311,000 | Cost of living, medical specialist access, elder care |
| New Hampshire | 21.5% | 303,000 | Property tax containment, preserving no-tax status |
| Montana | 21.2% | 241,000 | Rural clinical care, mail balloting, public land access |
| Pennsylvania | 20.4% | 2,670,000 | Social Security, Medicare preservation, property taxes |
| New Mexico | 20.1% | 429,000 | Doctor retention, community center funds, Medicaid |
| Wyoming | 20.0% | 117,000 | Hospital districts, mineral tax dividends, local control |
Several other states hover just below the 20% mark. Oregon sits at 19.9%, while South Carolina and Rhode Island both record 19.8% senior populations.
Conversely, Utah maintains the youngest demographic profile in the United States. Only 12.4% of Utah residents are 65 or older, making it the least senior-concentrated state in the country.
Beyond the Top 11: The Battleground States Where Seniors Decide Races
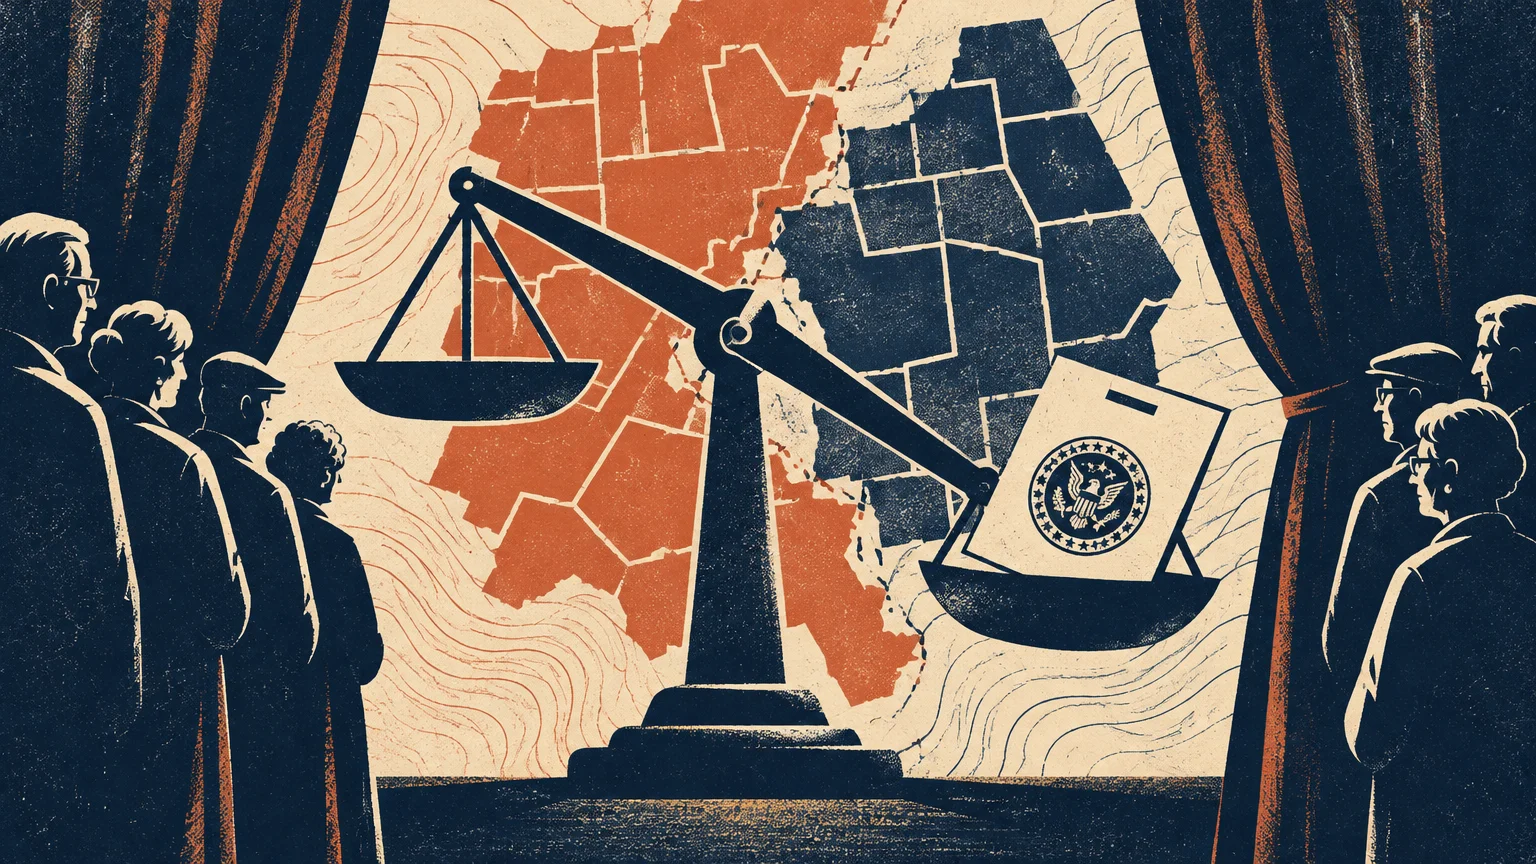
While the top eleven states boast the highest concentration of retirees, several major swing states feature massive older voter populations. In these battlegrounds, retirees determine the presidency and control of Congress.
Arizona features a senior population of 19.7%, accounting for nearly 1.5 million older residents. Sun City and Maricopa County retirees turn out reliably, making them the most scrutinized voting bloc in the Southwest.
Michigan’s senior cohort stands at 19.6%, representing nearly two million older adults. In 2024, state voter records revealed that voters aged 66 and older grew to 27% of all ballots cast, up from 22% in 2020.
North Carolina claims an older adult share of 17.9%, totaling nearly two million seniors. The state attracts thousands of retirees migrating from northern states to coastal communities and the Research Triangle.
In tightly contested races decided by tens of thousands of votes, retiree turnout swings the entire outcome. You can review federal and state support programs at USA.gov Benefits to see how federal election outcomes shape local programs.
How Retirees Cast Their Ballots: Mail, Early, and In-Person
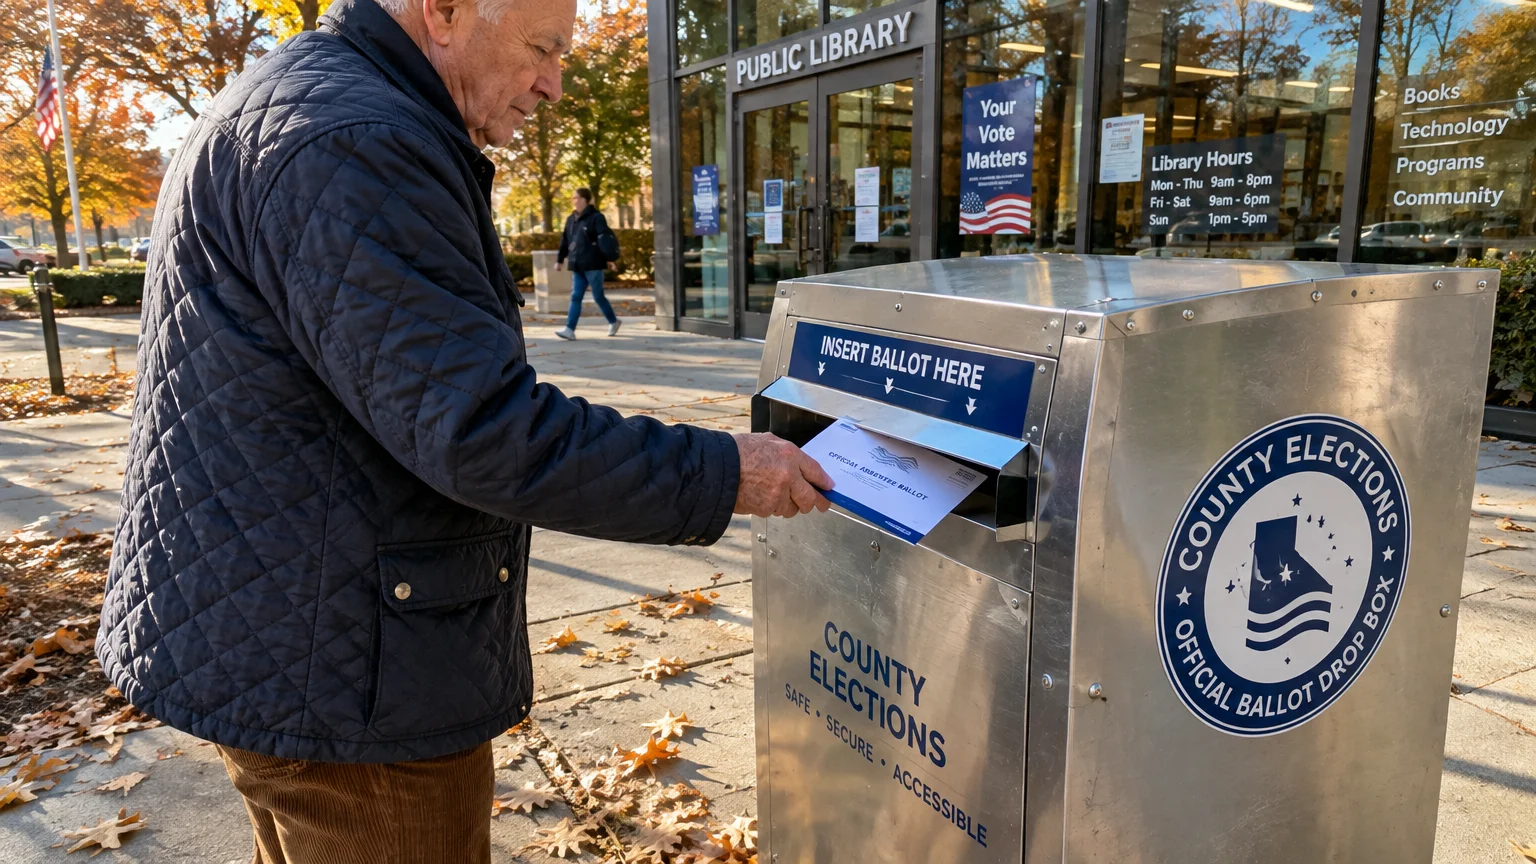
Older Americans utilize every available method to make sure their votes count. They adapt quickly to changing voting procedures and state-specific election guidelines.
According to Census Bureau data, 39.6% of older voters cast their ballots in person on Election Day. Another 30.7% voted early in person at designated voting sites.
Mail-in balloting accounted for 29.0% of all votes cast by seniors nationally. Currently, eight states and Washington, D.C., conduct universal vote-at-home elections that mail ballots directly to every registered voter.
Turnout rates vary dramatically depending on local voting infrastructure and civic culture. In the 2024 general election, New Jersey recorded the nation’s highest senior voter turnout at 84.7%.
Oregon took second place in senior turnout, supported by its decades-old universal vote-by-mail system. Flexible voting options consistently produce elevated participation among older adults who face transportation challenges.
Voting Access and Legislative Updates: Navigating 2026 Rules
Election laws across the country continue to evolve, requiring you to stay informed before heading to the polls. New statutory requirements can catch even lifelong voters unprepared if paperwork expires.
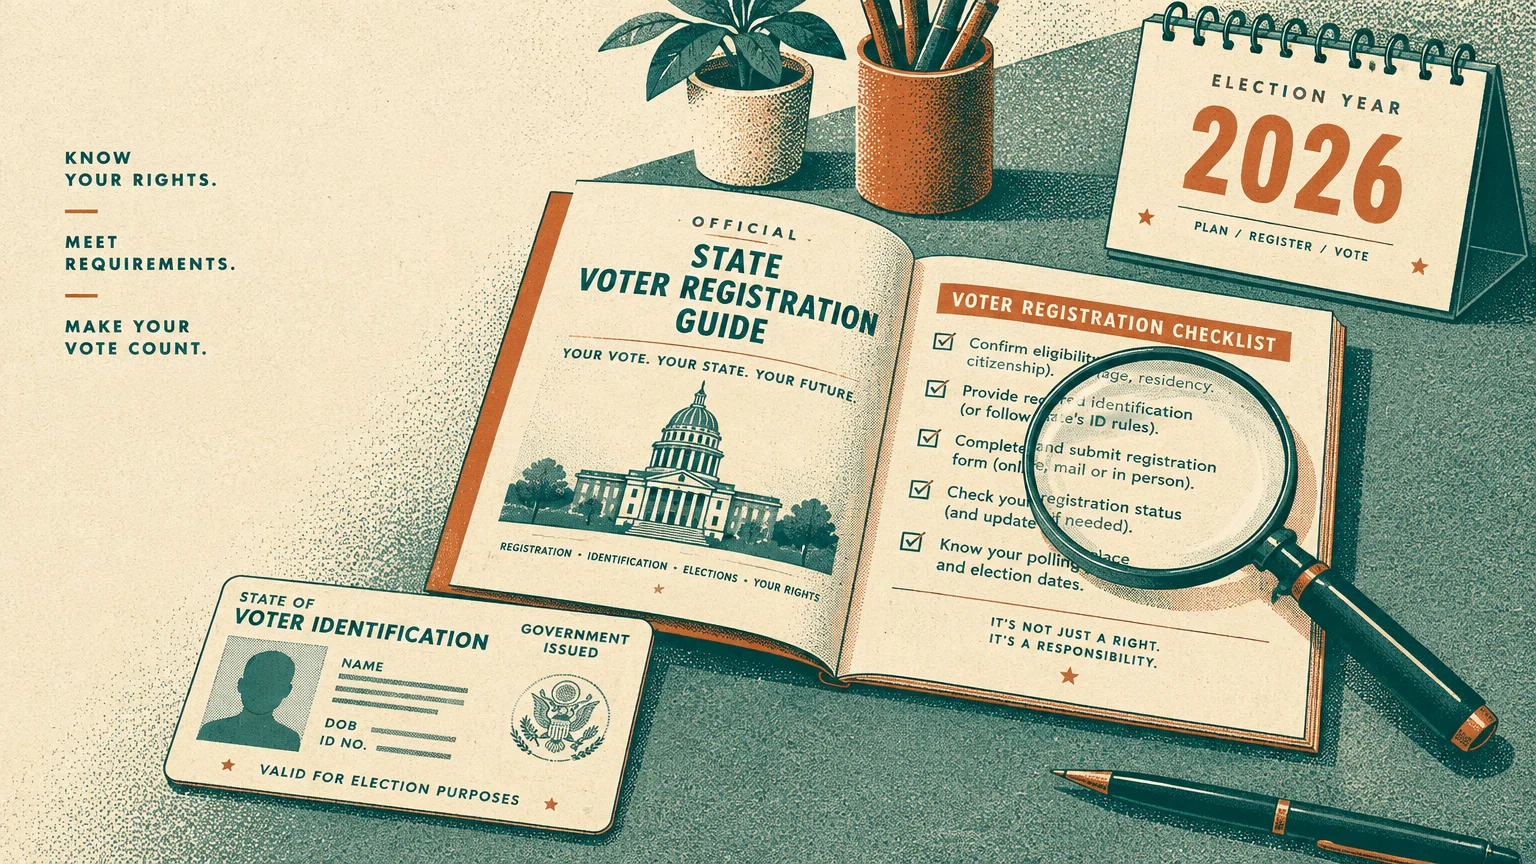
The U.S. House of Representatives recently passed the Safeguard American Voter Eligibility (SAVE) America Act, which awaits Senate action in 2026. This proposed legislation would fundamentally alter federal voter registration and mail-in rules.
Under the proposed bill, citizens must present documentary proof of U.S. citizenship, such as a passport or birth certificate, when registering. It would also mandate submitting a copy of a government-issued photo ID when voting by mail.
Senior advocacy organizations have highlighted potential obstacles for older Americans under these proposed guidelines. Many retirees no longer maintain active driver’s licenses or current passports after leaving the workforce.
Additionally, older women who changed their surnames upon marriage decades ago may encounter discrepancies between birth certificates and voter rolls. Staying ahead of these documentation requirements ensures your voice remains protected.
“An investment in knowledge pays the best interest.” — Benjamin Franklin, Statesman and Author
Actionable Steps to Protect Your Voting Power
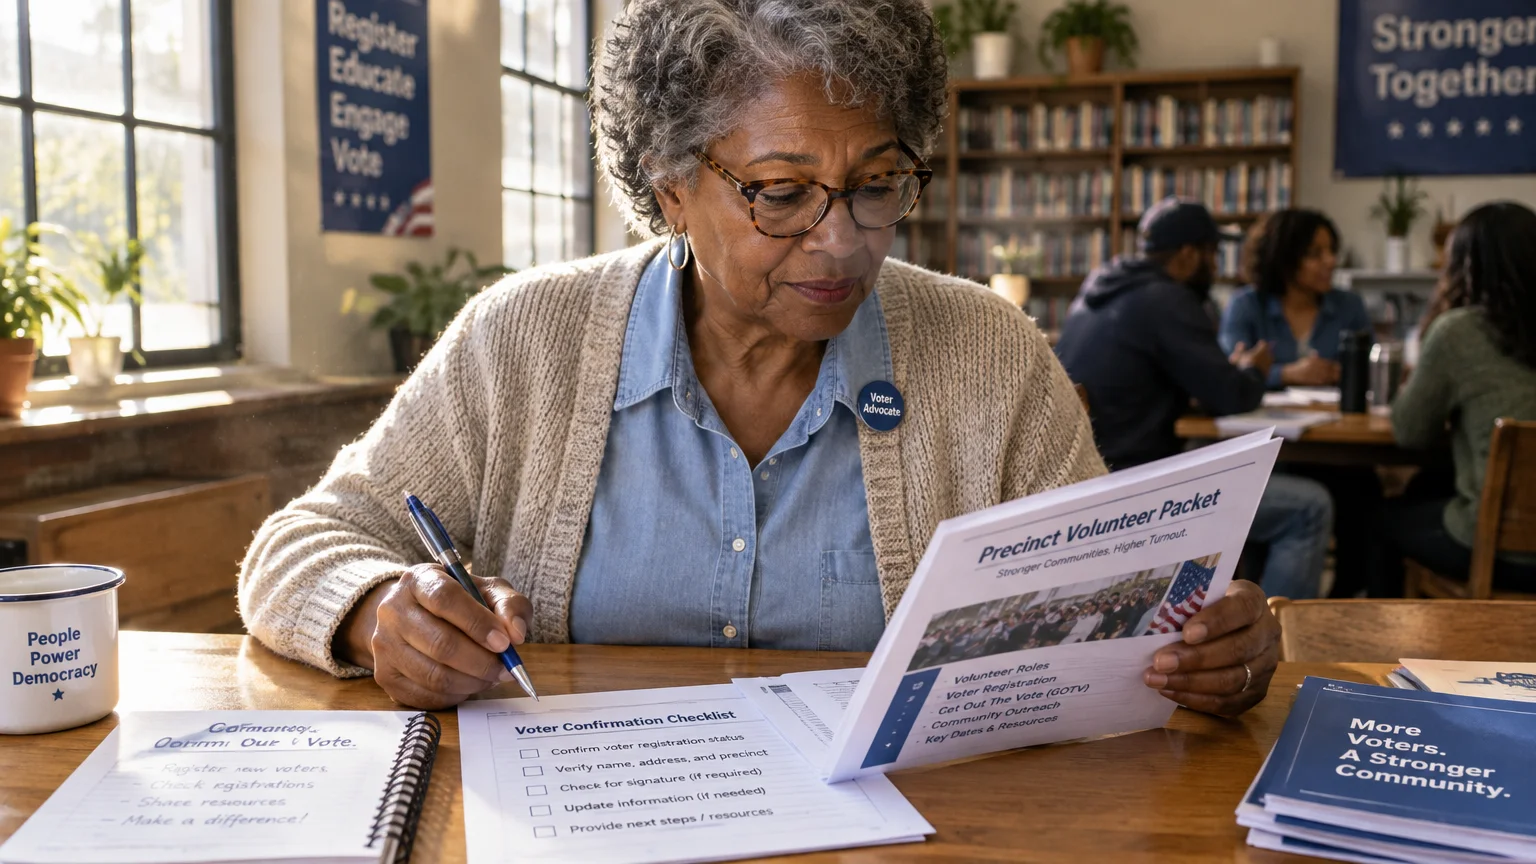
You can safeguard your ballot and ensure your voice shapes future retirement policies by taking proactive steps. Civic preparation eliminates surprises when election season arrives.
- Verify your voter registration status: Check your official county election website at least three months before every scheduled primary or general election.
- Audit your identification documents: Ensure your driver’s license, state non-driver ID card, or passport remains unexpired and matches your legal name.
- Request mail ballots well in advance: If you vote by mail, request your ballot as soon as the application window opens to avoid postal delays.
- Track your submitted ballot: Use state-sponsored online ballot tracking portals to confirm election officials received and accepted your vote.
- Learn local candidates’ stances on senior issues: Attend local candidate forums to ask specific questions about property taxes, healthcare, and transit.
By preparing your documents and understanding local timelines, you eliminate administrative friction. Your ballot remains your strongest tool for protecting retirement security.
Frequently Asked Questions
Which U.S. state has the highest percentage of senior voters?
Maine holds the highest percentage of seniors in the nation, with 23.5% of its total population aged 65 and older. Vermont follows closely behind at 22.9%.
Which state recorded the highest voter turnout for seniors in recent elections?
New Jersey recorded the highest voter turnout rate among eligible citizens aged 65 and older in 2024 at 84.7%. Oregon ranked second, aided by its universal mail-in voting model.
Do retirees vote more in presidential or midterm elections?
Senior voter turnout percentages remain exceptionally high across both election types. However, retirees make up a much larger share of total ballots during midterms because younger voter participation drops dramatically.
How might proposed photo ID laws affect older voters?
Proposals requiring documentary proof of citizenship or photo IDs for mail ballots can create hurdles for retirees with expired IDs. Women with changed names or seniors without passports face extra verification steps.
Why do candidates spend so much money advertising to older voters?
Retirees turn out at a 74.7% national rate, far exceeding younger cohorts. Candidates prioritize older voters because they reliably decide close elections in battleground states.
Make Your Voice Count in Every Election
Your civic participation drives the public policies that govern your healthcare, retirement savings, and local community. By remaining active and informed, you ensure that elected officials address the issues that matter most to older Americans.
Check your registration early, understand your state’s voting rules, and cast your ballot with confidence. The information in this guide is meant for educational purposes. Your specific circumstances—including income, health needs, tax situation, and goals—may require different approaches. When in doubt, consult a licensed professional.
Last updated: March 2026. Retirement benefits, tax rules, and healthcare regulations change frequently—verify current details with official sources.






Leave a Reply